The self-improving revenue system: GTM infrastructure that learns from every closed deal
A self-improving revenue system feeds closed-won, closed-lost, and campaign outcomes back into the models that decide targeting and spend. It recalibrates your ICP, corrects your TAM, surfaces audiences nobody briefed, and advises the next campaign.
Most GTM automation executes. It enriches the record, scores the account, fires the sequence, routes the lead. Then it does the same thing next quarter, on the same assumptions, while the market it was built for moves.
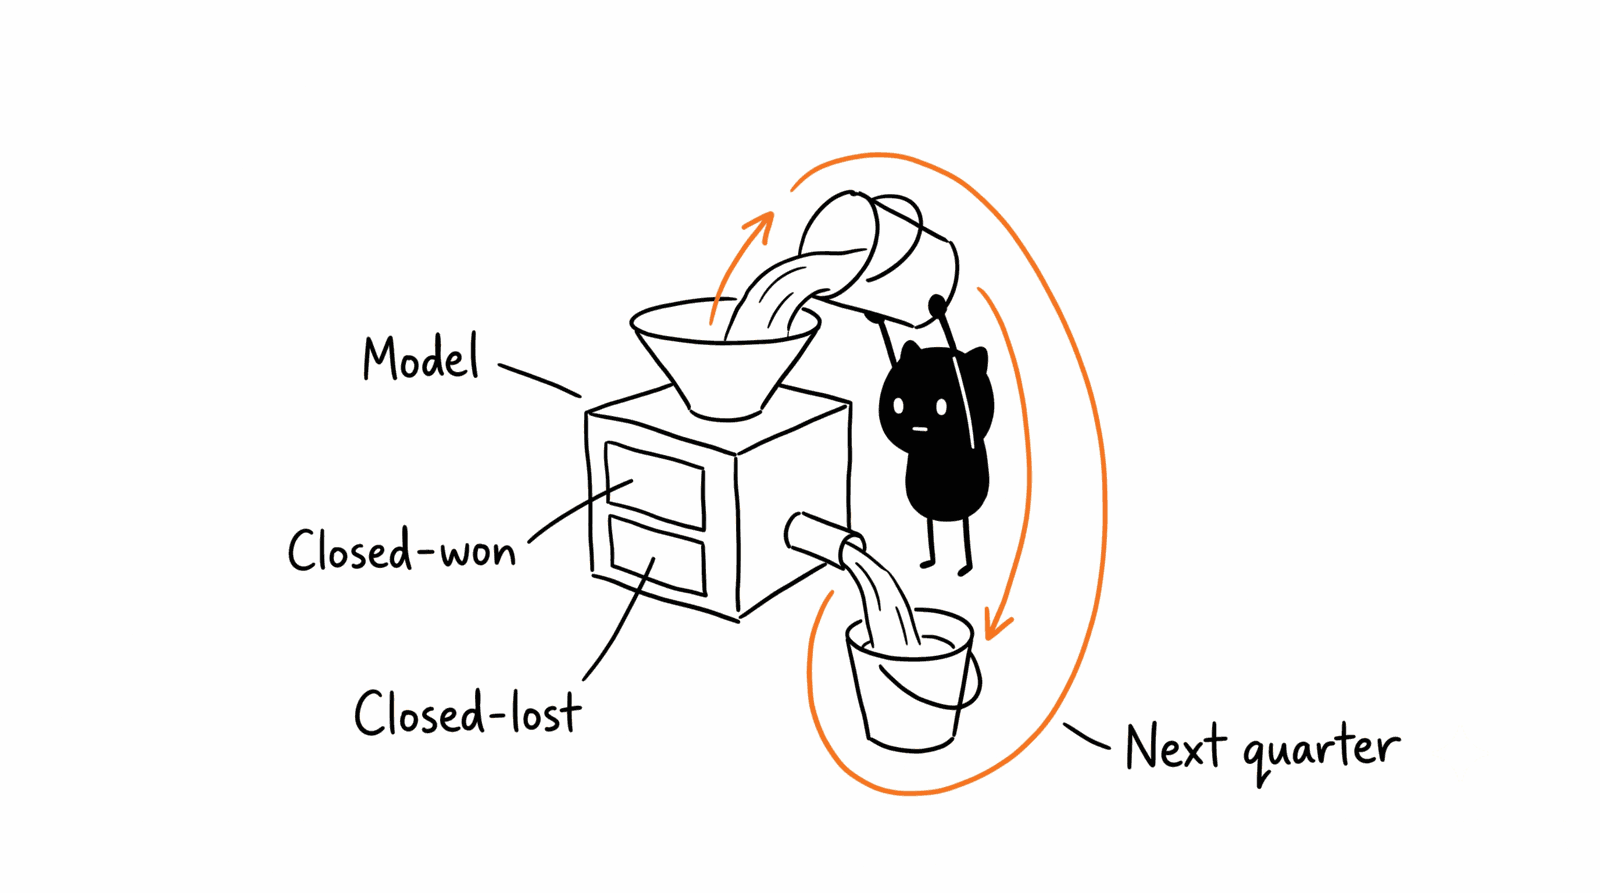
A self-improving revenue system closes the loop. Revenue outcomes flow back into the models that produced them: every closed-won and closed-lost deal recalibrates the ICP score, corrects the TAM number, adjusts the signal weights, and sharpens the advice for the next campaign. The system knows one quarter more than the version that shipped.
I build revenue systems in three stages: Foundation (data), Modelling (intelligence), Activation (execution). The learning loop turns that stack into a cycle. Activation produces outcomes, outcomes retrain Modelling, and the next play fires on a model that has seen your last hundred deals.
What is a self-improving revenue system?
A self-improving revenue system is GTM infrastructure with a closed feedback loop: closed-won and closed-lost deals, churn, campaign results, and call transcripts flow back into the models that decide targeting, messaging, and spend, on a schedule, without anyone commissioning a project.
Standard automation encodes the team’s assumptions once, at build time. The ICP weights come from a workshop. The signal triggers come from intuition. The message angles come from a positioning doc written twelve months ago. The system then executes those assumptions at scale while the product evolves and the ICP drifts, buyers change how they describe the problem, and the signals that used to precede pipeline stop preceding it.
None of the fix requires a data science team. The loop is a set of scheduled jobs: an export, a synthesis pass, a proposed diff against the current model, and a human sign-off. Your CRM holds the outcomes. n8n runs the schedule. Claude does the synthesis. Clay holds the scores.
Why does GTM automation decay without a learning loop?
Automation decays because it executes yesterday’s assumptions at scale. The model was right when it shipped. Nobody re-validated it since, and the gap between the encoded assumptions and the actual market widens every quarter it runs.
The decay never announces itself. A static scoring model keeps producing scores. Sequences keep sending. Dashboards stay green. Conversion sags a few points a quarter, the team debates channel mix, and nobody audits the model, because the model is not on the list of suspects.
You can see the same decay in positioning that drifts from buyer language and in signal weights set by feel and never checked against what actually converted. A revenue system inherits the shelf life of its most stale model.
What does the learning loop actually learn?
Nine loops cover the practical range, from quarterly ICP recalibration to the confidence thresholds on your own automation, capped by an operator digest that turns all of it into Monday priorities. Each one feeds on outcome data the business already produces and updates a model the business already runs on.
It re-learns your ICP
Each quarter, the system compares closed-won against closed-lost and churned: which firmographic and behavioural attributes separated the groups, which personas showed up in winning buying committees, which current scoring criteria predicted nothing. Churn and no-decision patterns become exclusion criteria, a negative ICP that stops sales working accounts that resemble past regrets.
It corrects your TAM
The TAM stops being a slide from the last planning cycle and becomes a number under maintenance. Wins outside the assumed ICP widen it. Segments that never convert, across enough attempts, get cut from the serviceable market. ICP scoring and TAM sizing stay separate methodologies; the loop maintains both instead of letting one contaminate the other.
It suggests audiences nobody briefed
Clustering a year of won deals surfaces segments no strategy meeting proposed: a vertical that keeps buying for a use case marketing never wrote down, a company profile that closes fast at twice the ACV. Champion job changes generate net-new accounts on a timer. Closed-lost deals re-enter the audience when the condition that killed them changes, a funding round after a budget loss, a new executive after a champion exit.
It improves and advises on campaigns
Campaign post-mortems run on schedule instead of in retro decks. The loop reads spend, conversion, and creative performance, then returns decisions: which budget to move, which creative is fatiguing, which message angle won deals actually referenced. Buyer language from transcript synthesis replaces internal product vocabulary in the next batch of copy. Signal weights get tuned against what preceded pipeline, so the cluster thresholds that trigger micro-campaigns tighten with every cohort.
It learns who should work each lead
Routing rules encode a guess about territories and capacity. The loop replaces the guess with evidence: speed-to-lead checked against conversion, by rep and by segment, every month. A rep who converts fintech accounts at twice the team rate starts receiving the fintech accounts. An SLA threshold that costs meetings gets tightened with the numbers attached. Routing on enriched data is the static version; this one notices which routes pay.
It writes its own content brief
The content plan stops being a calendar and becomes a response. The loop reads which pages answer engines cite, which queries surface in search console, and which questions prospects ask on first calls that no page answers yet. The gap between asked and answered becomes next month’s writing list, and pages losing citations get refreshed before the traffic goes. The citation rate from pipeline that compounds stops being a metric you report and becomes a signal the system acts on.
It watches the customers you already won
The richest outcome data sits post-sale, where most GTM loops never look. Usage milestones that preceded past expansions become expansion triggers. The support-ticket language that showed up before past churn becomes an early-warning score. Churn reasons feed the negative ICP, so the acquisition side stops buying accounts that resemble the ones you lost. One loop covers both ends of the revenue number.
It learns how much to trust itself
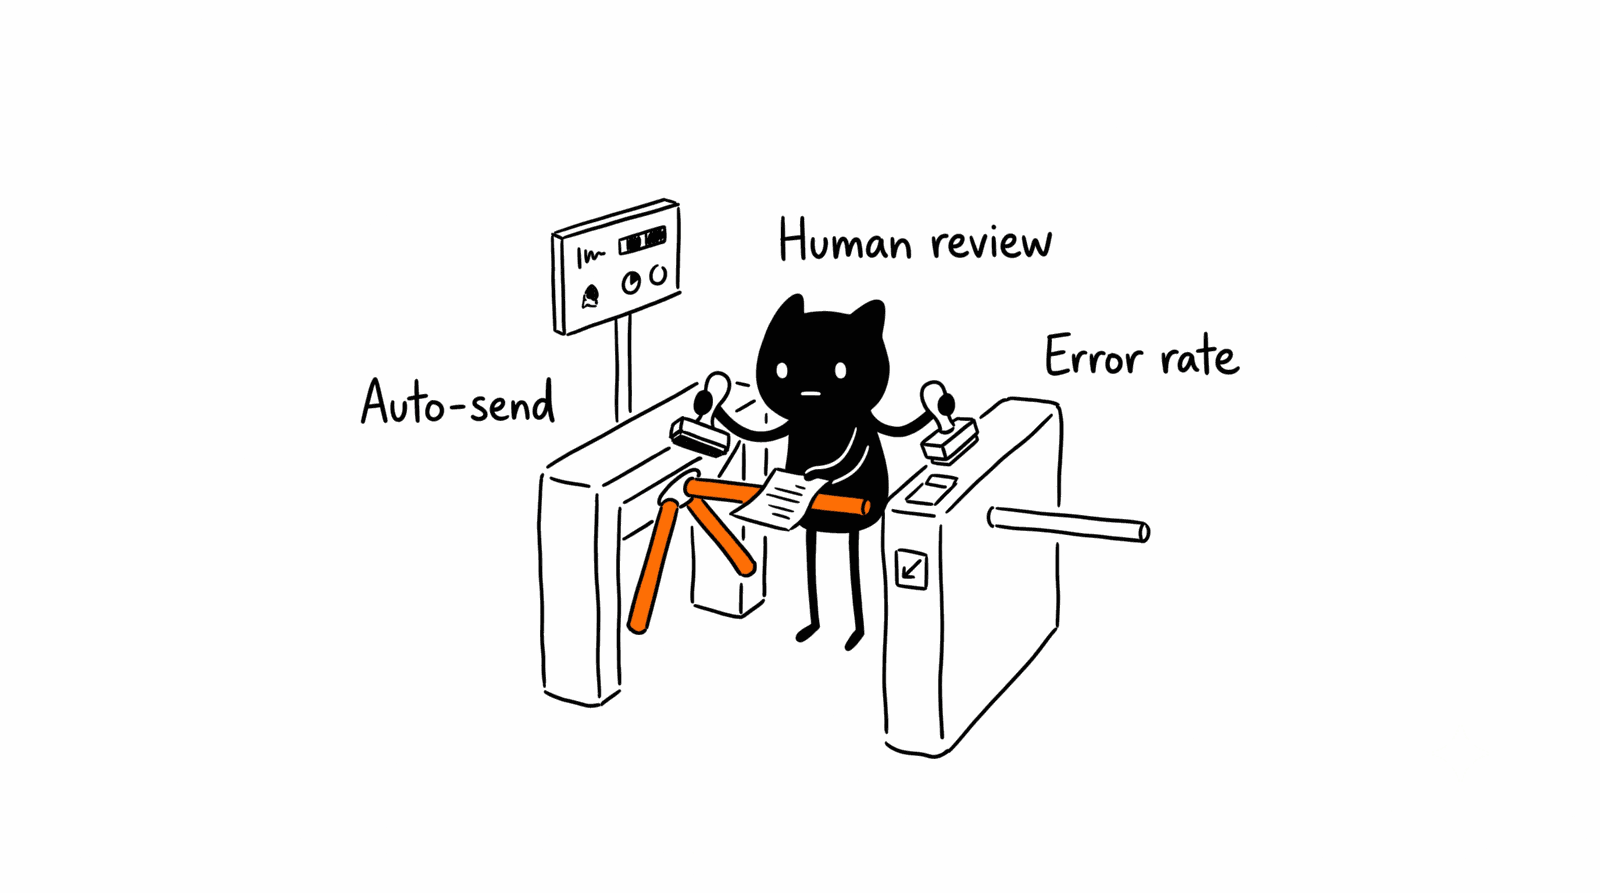
Every automated play carries a confidence threshold: above it, auto-send; below it, a human reviews. Most teams set those thresholds once, by feel. The loop audits them monthly, comparing the error rate of auto-sent plays against human-reviewed ones by play type. Where the machine matches the human, the threshold drops and review time moves to the plays that need it. Where auto-send underperforms, the boundary moves back. Knowing what not to automate stops being a judgment call made once and becomes a measurement the system keeps taking.
It advises the operator
The top of the system is a weekly digest: what changed, what it means, what to do. Ten accounts that moved, two segments outperforming their tier, one campaign to cut, one test worth running. A dashboard hands you data and leaves the judgment; the advisor layer returns the judgment and links the evidence.
| Loop | Feeds on | What updates | Cadence |
|---|---|---|---|
| ICP recalibration | Won/lost/churn records, call transcripts | Scoring weights, tier definitions, negative ICP | Quarterly |
| TAM correction | Wins vs assumed ICP, segment conversion | TAM and SAM numbers, segment priorities | Quarterly |
| Audience suggestion | Won-deal clusters, job changes, lost-deal conditions | New segments, net-new account lists | Monthly |
| Campaign advice | Spend, conversion, creative data, transcripts | Budget splits, creative rotation, copy angles | Weekly |
| Signal tuning | Signal-to-pipeline correlation | Trigger weights, cluster thresholds | Monthly |
| Routing | Speed-to-lead, rep-by-segment conversion | Routing rules, SLA thresholds | Monthly |
| Content and AEO | Citation rate, search queries, first-call questions | Writing list, refresh priorities | Monthly |
| Churn and expansion | Usage milestones, support tickets, churn reasons | Health scores, expansion triggers, negative ICP | Quarterly |
| Autonomy | Auto-send vs human-review error rates | Confidence thresholds, review boundaries | Monthly |
| Operator digest | All of the above | The team’s Monday priorities | Weekly |
How does a learning loop fix your TAM instead of shrinking it?
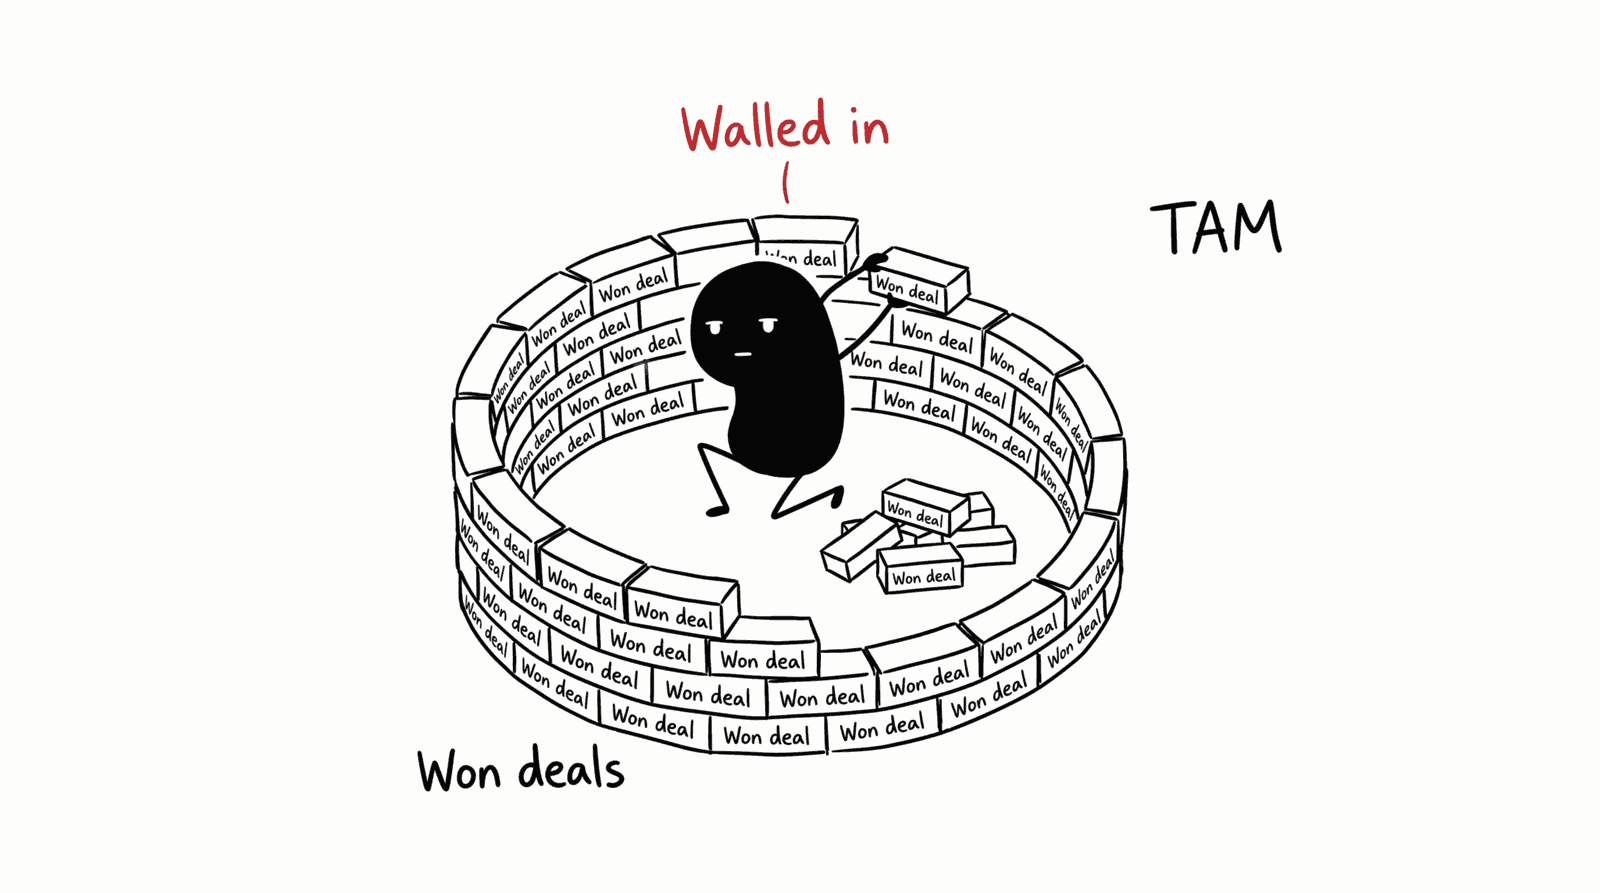
Built naively, it shrinks it. A loop trained only on closed-won data learns where you already sell and pulls every model toward your past. The ICP tightens around your existing customer base, the TAM number falls, and the system congratulates itself on precision while it walls you into your own history.
The bias is in the training data. Your won deals are a sample of companies that found you, evaluated you, and bought. Thousands of companies with the same operational problem have never heard of you, and the loop has zero examples from any of them.
The fix is to make the loop classify segments three ways before it touches the TAM: segments you win and lose in, where outcome data means something. Segments you only lose in, which need diagnosis before exclusion, because the loss reasons might be fixable. And segments you never entered, where the system has no data and must say so instead of scoring them low. Absence of wins in a segment you never worked is not evidence against the segment.
Then the loop earns the “self-improving” label: it recommends the test, not just the retreat. A small exploration budget goes to never-entered segments that share the operational problem your won deals keep describing. If the test converts, the TAM number rises on evidence. Your competitors’ models, trained on their own history, cannot see the segment at all.
How do you build one loop end-to-end?
Start with quarterly ICP recalibration. It has the highest leverage per hour of build time, and the pattern generalises to every other loop. Five steps.
- Capture outcomes as structured data. Closed-lost reasons as picklist fields, required at stage change, not free text in a notes box. Churn reasons the same. This is Foundation-layer work, and if the CRM is not clean, fix that first; a learning loop pointed at bad records learns bad lessons.
- Assemble the quarter’s evidence. An n8n job exports every won, lost, and churned account with firmographics, engagement history, source signals, and loss reasons, and pulls the matching call transcripts from Gong, Chorus, or Fathom.
- Run the synthesis. Claude takes the current scoring model and the quarter’s evidence through the prompt below and returns what separated wins from losses, where the current model drifted, and a proposed set of weight changes with the evidence attached.
- Diff, don’t deploy. The output is a proposed diff against the current model, reviewed by a human in about thirty minutes a quarter. The scoring model lives in version control like any other GTM logic, so the change ships as a commit with the reasoning in the message.
- Push the approved changes and log them. Updated weights go to the Clay scoring columns, refreshed tier definitions go to the LinkedIn and Madison Logic audiences, routing thresholds update in HubSpot or Salesforce. Next quarter’s run evaluates whether the changes worked, which is the moment the system starts improving itself rather than just changing.
| Component | Tool | Job |
|---|---|---|
| Outcome store | HubSpot or Salesforce | Won/lost/churn records with structured reasons |
| Evidence assembly | n8n | Scheduled exports and transcript pulls |
| Synthesis | Claude | Pattern extraction and the proposed model diff |
| Scoring layer | Clay | ICP score columns, tier assignment |
| Activation surfaces | LinkedIn, Madison Logic, CRM workflows | Audiences and plays that consume the updated model |
The prompt:
You are a revenue analyst reviewing one quarter of closed deals to recalibrate an ICP scoring model.

I will provide: (1) the current ICP scoring criteria and weights, (2) closed-won accounts with firmographics, engagement history, and source signals, (3) closed-lost accounts with the same fields plus structured loss reasons, (4) churned accounts with churn reasons.

Return four sections:

1. Attributes that separated won from lost this quarter. Only include attributes with a meaningful gap between the two groups, and quote the numbers.

2. Drift against the current model. Which current criteria failed to predict outcomes this quarter? Which attributes predicted outcomes but are missing or underweighted in the model?

3. Proposed scoring changes. A specific diff: attribute, current weight, proposed weight, evidence. Maximum five changes per quarter. If the evidence is thin, propose nothing.

4. Anomalies worth a human look. Wins outside the current ICP definition, losses inside it, and any segment where every deal was lost. Flag each as pattern or one-off.

Do not propose a change supported by fewer than 10 accounts. If the quarter's sample is too small to support a section, say so instead of inferring.

Current model: [paste scoring criteria and weights]
Deal data: [paste the quarter's exports]
When does a self-improving system fail?
Four failure modes account for most of the wrecks.
Small sample sizes. Below roughly 30 closed deals a quarter, weight changes are noise-fitting. Run the loop anyway, but treat the output as qualitative synthesis: buyer language, objection patterns, and anomaly flags hold up at low volume long before the statistics do. Transcripts carry the loop until deal count catches up.
Feedback bias. The shrinking-TAM trap above. If the loop has no exploration budget and no never-entered classification, it optimises you into a corner one confident quarter at a time.
Auto-applied changes. A bad weight that ships without review compounds for a full quarter across every play that consumes the score. Model changes are code changes: proposed, reviewed, committed, reversible.
The wrong objective. Point the loop at MQL volume and it learns to manufacture MQLs. Every loop in the system anchors on pipeline and revenue, or the system gets better each quarter at a game that was never worth winning.
FAQ
What data does a self-improving revenue system need?
Structured outcome records (won, lost, and churned, each with reasons), engagement and source history per account, call transcripts, and campaign performance data. All of it already exists in the CRM, the call recorder, and the ad platforms; the loop assembles it on a schedule rather than requiring a warehouse project.
Do you need machine learning to build one?
No. The working pattern is scheduled exports, LLM synthesis, and explicit scoring rules kept in version control. Rules stay legible, and a human reviews every change before it ships. Proper ML models can replace components later; the feedback loop is the prerequisite either way.
How is this different from lead scoring?
Lead scoring is a model. A self-improving revenue system is the process that retrains it. Most scoring models get built once and then execute unchanged, which makes the score a snapshot of old assumptions. The loop is what keeps the score describing your current buyers.
How long before a learning loop pays off?
The first recalibration lands at your first quarter-end with structured outcome data, and transcript synthesis produces usable messaging findings in the first run. Compounding shows up after two to three cycles, once each quarter’s run starts evaluating the changes the previous run proposed.